PpSignal Chandelier Stop, supertrend and BB Band Great combination indicator with atr Technic. buy when the chandelier and BB band is green sell in red signal background... ENJOYYYYYY
[b]forex

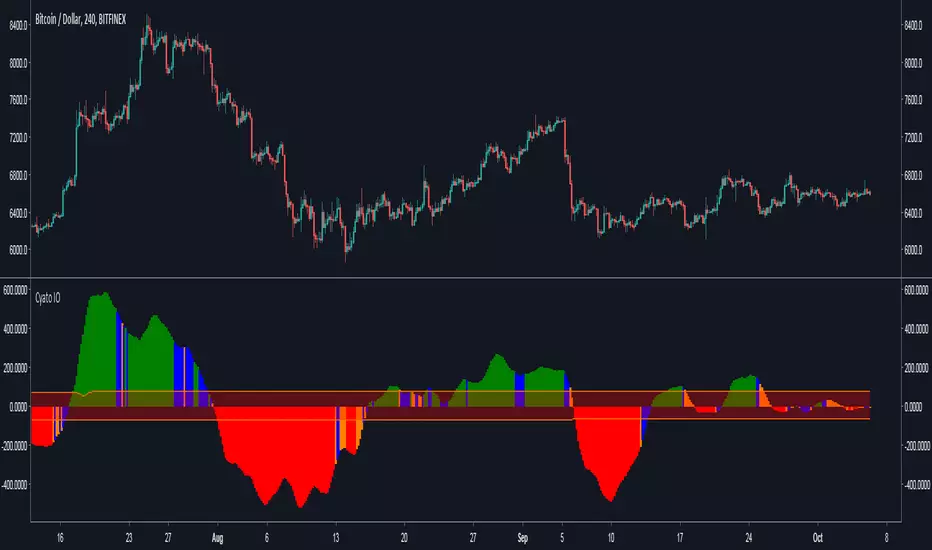
Cyatophilum Ichimoku Oscillator [ALERT SETUP]Hello, I built an oscillator based on Ichimoku trading rules. I wanted something simple to use, but powerful, with automated alerts that would help us trade breakouts and trend reversals.
The indicator can be used on all timeframes and everywhere : Crypto, Forex, Index, Stocks, Futures, CFD.
Basically, green bars equals bull market and red bars equals bear market.
Blue and Orange bars show potential breakouts and you can setup automatic alerts for receiving an email or SMS when it happens.
You can also setup alerts for new highs and new lows indicating a potential trend reversal.
The narrow channel in the middle indicates consolidating periods and unsignificant trades, because we know Ichimoku performs badly in range markets.
For more information on how to use it, I made a description page at the link below.
Sample Use Cases :
BTCUSD 4H
BTCUSD 2H with New Highs/Lows on chart (blue and red circles correspond to alert conditions)
BTCUSD 1H
ETHUSD 2H
Use divergences with price action to trade breakouts.
More information on my website
blockchainfiesta.com
Purchase this indicator today and get access to my other Cyatophilum Indicators that will help you in your trading
blockchainfiesta.com
Happy trading!
Forex CorrelationsA utility tool to find linear relationships between different currency pairs and
specified symbols. This is another private indicator of mine.
Features
37 well known Forex pairs
3 correlation display modes ( Positive and Negative , Positive , Negative )
Ability to specify any symbol to see correlations
Ability to specify a preferred timeframe
Readable and optimized code
Supported pairs
USDCAD
USDMXN
USDBRL
USDCHF
USDRUB
USDTRY
USDZAR
USDJPY
USDCNY
USDHKD
CADCHF
CADJPY
EURUSD
EURCAD
EURGBP
EURCHF
EURRUB
EURTRY
EURJPY
EURCNY
EURAUD
EURNZD
GBPUSD
GBPCAD
GBPJPY
GBPCNY
GBPAUD
GBPNZD
AUDUSD
AUDCAD
AUDCHF
AUDJPY
AUDCNY
AUDNZD
NZDUSD
NZDJPY
NZDCNY


PpSignal Variable Moving AverageVMA is a amazing moving average. you can follow the trend support and resistance . buy when the ma is green and sell when the ma is red. in gray color don t do nothing please.
Ppsignal Smoothed Heiken Ashi Candles and Keltner Channelwe have a KC, haiken hashi smoothed and KC trendirection, buy when the background is green and sell when the background is red.

Correlated Market Matrix - Correlation Computer - GyromaticalCorrelated Market Matrix - Correlation Computer
Works with up to 7 markets simultaneously to find price divergences.
Study Forex pairs, stocks, crypto alt coins.
Find potential entries quicker.
Short Description:
This indicator analyzes 6 markets and one spread (or 7 and no spread) against the currently loaded instrument,
with support for complex formulas. This indicator finds positive and negative correlations intrabar and throughout
the specified time frame simultaneously. It employs a weighting system and score threshold
(everything is user-definable) and signals upon positive or negative score. Alerts are included
for intrabar and overall positive and negative correlations.
Detailed description:
This indicator analyzes 6 different markets and 1 spread (or 7 different markets if no spread) and
measures correlations between them. The squares on the background are individual
correlations (intrabar) and the circles to the right-hand side depict whether the markets have risen
or fallen in price since the start of the specified time frame (red/green or gray for neutral).
To the right of the circles you have the instrument numbers. The numbers represent the instruments you
have specified, in order. Above these numbers and circles you will find two square icons.
You will notice the left-most icon has the caption of "Overall Score +" (or -) and the right-most icon
has the caption of "Intrabar Score +" (or -). The overall score measures the correlation score from the
start of the time frame to the present time. The intrabar icon measures the correlation score of
individual candles. The scoring system implements weighting which uses scores for each individual instrument
and all scores are user-definable (positive and negative). There is also a threshold level which is user-definable,
if the score reaches or crosses this level it will trigger the aforementioned signal icons.
The analyzation time frame is decided by the user. The Correlated Market Matrix can calculate from a
given date to present (real-time), or between two specified historic dates.
You are able to represent the correlations using the close (price) of the instrument or an EMA (speed is user-adjustable).
The spread has the individual option to use EMA or close (price) separately from the other instruments.
You have the option to assign the weight of any number (0 to 100) to any instrument if the instrument is bullish.
You additionally have the option of subtracting the numbers if it is bearish (-100 to 0).
You may assign both bullish and bearish weights to each instrument at the same time to obtain maximum balance.
If you do not desire custom weighting, simply leave the weights at 1.
The negative vs positive levels are then measured, and whichever score is the strongest determines if the
square icon displays "Overall Score +" or "Overall Score -" (same for Intrabar).
"Score +" means that the score is equal to or greater than the threshold.
"Score -" means that the score is less than the threshold.
Additionally you are provided the option of visualizing the actual correlation lines. This is useful in the sense that
you may view the direction of that particular secondary instrument without actually opening its chart. The color red
implies that the correlation is falling, while green implies it is rising. Please note that due to
limitations you cannot see the actual correlation value of these lines, and also this is an experimental feature so lines
may not always appear appropriately. In testing a line may vanish momentarily here and there but it is somewhat rare.
The background squares will tell you the actual state of the correlation.
HOW DO YOU READ IT?
The numbers represent the instrument you selected in that number slot.
The circles to the left of the numbers indicate if that market is up or down since the beginning of the specified timeframe.
Red means price is down, green means price is up, gray is neutral.
The icon "Intrabar Score +" or "Intrabar Score -" indicates whether the majority of markets are over their score threshold
(negative or positive correlation) for the current candle only.
If this is "Neutral" then there is no current score.
The icon "Overall Score +" or "Overall Score -" indicated the majority of markets are over their score threshold (negative or
positive correlation) for the OVERALL time frame (start to current, or start to finish if you are not using in real-time).
If this is "Neutral" then there is no current score.
For individual candle correlations, if the secondary instrument is up and the main instrument is down, the boxes are red.
If secondary instrument is down and main instrument is up, boxes are green.
If correlation lines are red then the correlation is becoming negative, if they're green then they're becoming positive.
This does not mean there is a negative or positive correlation, only that the correlation is rising or falling.
The background squares will tell you the state of the correlation.
PLEASE NOTE:
If you are using a white or bright colored chart, click the gear icon next to the indicator name.
Select the "Style" tab. The first option "Time frame Background Color" should be adjusted to either
black or white with no transparency (take note of the slider underneath the color squares).
This will make the matrix appear correctly.
INPUT MENU
By clicking the gear icon next to the indicator name, you are presented with a host of options.
The options are as follows, in order of appearance:
- Correlation Length : Amount of bars to look back for the correlation.
- Show Correlation Lines : Chose whether to display the correlation lines or not.
- Use Rising/Falling Colors : Use rising/falling colors for correlation lines instead of unique colors.
- Instrument Source : Chose from 'Price' or process the instrument through EMA instead.
- Price Source : This source works for both "Price" source and the EMA source.
- EMA Speed : Speed of the EMA if 'Instrument Source' is set to 'EMA'.
- Use EMA on Spread 1 : Use EMA on the 'Spread Instrument 1'. If unchecked, close is used by default.
- Use EMA on Spread 2 : Use EMA on the 'Spread Instrument 2'. If unchecked, close is used by default.
- EMA Speed for Spread 1 : Speed of EMA for Spread 1 if EMA is used instead of 'close'.
- EMA Speed for Spread 2 : Speed of EMA for Spread 2 if EMA is used instead of 'close'.
- Disable Spread and use Instrument 1 as correlated market instead : By default, the indicator takes both spread
instruments and calculates the spread between each (instrument1-instrument2=spread). If this feature is enabled, the indicator
will use only the 'Spread Instrument 1' and calculate it in the same manner as the other markets.
This is useful if you do not wish to use a spread and would rather have an extra market.
- Positive Weight of Instrument (1-7/spread) : Positive weight for the instrument.
It is recommended to enter only positive numbers here. If left 0, no weight will be added to the instrument but the indicator will
signal "Score -" if all others are also 0. If left at 1, if more markets are positive than negative, the indicator will present "Score +".
- Negative Weight of Instrument (1-7/spread) : This works in the same way as positive weight except it is recommended you enter
only negative numbers here (example: -1.5, -20). This number is subtracted from the overall score. If left 0, no weight will be
added to the instrument but the indicator will signal "Score -" if all others are also 0. If left at 1, if more markets are negative than positive,
the indicator will present "Score -".
- Threshold for score to be determined : if the weighting score of the instruments is this number or greater then
the square signal icon of + (greater) or - (lesser) is triggered.
- Instrument (1-6) : This is where you select which instruments/securities you wish to analyze. This input also
supports complex formulas, same as you'd enter them on your chart.
- Spread Instrument 1 : Instrument of part 1 of spread calculation
- Spread Instrument 2 : Instrument of part 2 of spread calculation
- From Month/Day/Year/Hour/Minute : Display data beginning at this specified time.
- To Month/Day/Year/Hour/Minute : Stop analyzing data at this specified time. To have it calculate indefinitely
in real-time, then the "To" settings should be left at Month: 12, Day: 31, Year: 2222, Hour: 23, Minute: 59.
STYLE MENU
- Time frame background color : The background color of the viewing area, especially helpful for white charts where colors may become faded.
- Correlation Line (1-7) : Properties for the displayed lines (if enabled). The first two colors are for rising and falling respectively
(if "Use rising/falling colors" is enabled), the last color is the default color of the line. This last color
will also be used for neutral if "rising/falling" is enabled.
- Instrument Label (1-7,Spread) : Properties for the right-hand numbered column, denoting which line is which instrument.
- Separator (1-8) : Solid lines between instruments
- Price Circle (1-7) : Circles between labels and background colors, denoting price rise/fall.
- Score + or - : Score icon above the instrument numbers
- Fill Row (1-6, Spread) : Background colors for the matrix. Default is red and green.
Have an idea? Customized logic is available for this framework.
This is not financial advice and this indicator system does not guarantee or claim to make profit.
The signals and ideas contained within this page and indicator are provided on an as-is basis. Use at your own risk.

PpSignal Chandelier StopThere are few indicators for MT4 which draw trailing stop line. I prefer to use Chandelier Stops. I believe that with good money management this is one of the best tools to follow a trend.
About ATR trailing stop loss (Chandelier Stops)
When you catch trend you can profit from most of the move. The good thing about ATR is that you have a stop loss level in place. When there is a close on the other side of ATR, it is a signal to close. No second guessing.
Best time frame for ATR trailing stop loss
I strongly recommend time frames such as 30m or larger. On lower time frames like 5m there is too much algo trading. I trade with ATR on 1h or 4h charts.
Parameters for trailing stop
Depends on pair or instrument. In most cases standard parameters will be fine. If I change anything then it is usually a Kv parameter. Standard is 3.5 and I tend to make it bigger like 3.7 or 4.0. In most cases it is around 3.7.
ATR trailing stop loss (Chandelier Exit) – Metatrader download
January 1, 2018 by simon in forex indicators
In this section you can download ATR trailing stop loss (Chandelier Exit) for MetaTrader:
– download ATR trailing stop loss (Chandelier Exit) for MetaTrader 4 –
There are few indicators for MT4 which draw trailing stop line. I prefer to use Chandelier Stops. I believe that with good money management this is one of the best tools to follow a trend.
About ATR trailing stop loss (Chandelier Stops)
When you catch trend you can profit from most of the move. The good thing about ATR is that you have a stop loss level in place. When there is a close on the other side of ATR, it is a signal to close. No second guessing.
Over 300 pips in profit thanks to ATR stop
Over 300 pips in profit thanks to ATR stop
Best time frame for ATR trailing stop loss
I strongly recommend time frames such as 30m or larger. On lower time frames like 5m there is too much algo trading. I trade with ATR on 1h or 4h charts.
Parameters for trailing stop
Depends on pair or instrument. In most cases standard parameters will be fine. If I change anything then it is usually a Kv parameter. Standard is 3.5 and I tend to make it bigger like 3.7 or 4.0. In most cases it is around 3.7.
Remember, it depends from pair and current situation in the market. You should experiment with few settings and check it on historical price action if they are ok.
Best pairs to trade with ATR trailing stop loss
Trailing stop loss works best in trending markets. That is why you should check pair if it tends to move strong or to move in range. It is not the secret that yen pairs line to move strongly. If you are looking for solid trends, you can’t go wrong with GBPJPY or EURJPY.

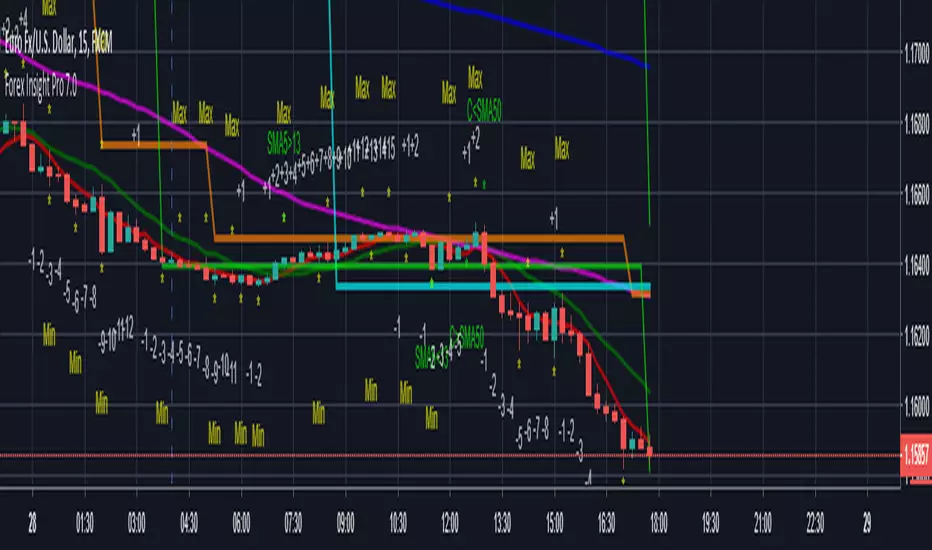
Forex Insight Pro 7.0Forex Insight Pro 7.0 for TradingView gives you abilities to see the stories hiding in the graphs of the markets. It marks and reminds you about important parameters that are happening on the graph so that you will not forget to consider them before placing orders. These parameters include:
Automatic CC(X) counting that compare the close of the right price bar to that of left price bar in a group of X consecutive bars such as CC(5,9) of a group of 5 bars will compare the close price of the right bar to the left bar (ignoring 3 bars in the middle). If the right bar closed higher, the count positive number would be printed above the bar. If the left bar closed higher, the count negative number would be printed below the bar. Nine consecutive series of up counts will define the lowest price as CC(5,9) support line and nine consecutive series of down counts will define the highest price as CC(5,9) resistance line. The count numbers and support / resistance lines are automatically printed on the graph if enabled.
Show a set of simple moving average lines such as SMA5, SMA13, SMA50, SMA200, SMA800, if enabled. The color of SMA50 line (which is the same as the the middle line of Bollinger band (50,2) can be set to change based on increasing/decreasing values of itself, or of the MACD(12,26,9).
Show Bollinger bands (50,2), if enabled.
Show the high and low levels of the previous day, if enabled.
Show the important time areas for Forex trading during Asian, London, and New York sessions, if enabled.
Automatic printing of the events happening in the graph to remind the readers of parameters under considerations (if enabled) including:
- Print "SMA5>13" and "SMA5<13" for SMA5 crossed above and below SMA13.
- Print "SMA50>200" and SMA50<200" for SMA50 crossed above and below SMA200.
- Print "Max" and "Min" for local maximum and local minimum bars.
- Print "C75" and "C25" for the bars that closed above 75% and closed below 25% of its ranges.
- Print "C>SMA50" and "C30" and "RSI<70" for RSI(14) that crossed above 30 % and below 70 %.
- Print "MACD>0" and "MACD<0" for MACD(12,26,9) that crossed above and below zero.
- Print "MACD>Sig" and "MACD
Zentrading Trend Follower_v1.1For more information on how to use and how to subscribe please visit
www.zentrading.co
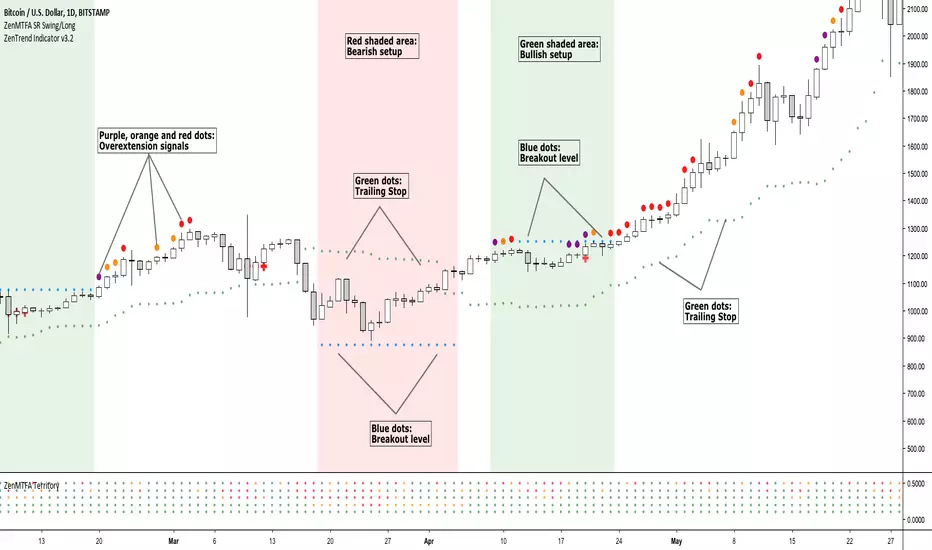
Our ZenTrend Follower is designed to get you into trends in a safe an risk averse manner. It does not only provide you with buy and sell signals forcing you to either react quickly or miss the trade. Rather, our algorithm detects when a trend setup is active and plots a breakout level where you can enter the trade. This also makes it easy for you to scan many assets quickly: All you need to do is see if the indicator has detected a setup, if not, move on!
To ensure that you capture the trend, the indicator indicator shows you where to place your stop loss as the trend progresses. We will also show you a few other simple ways to exit the trades at higher profit levels in the detailed manual you receive after purchasing the indicator.
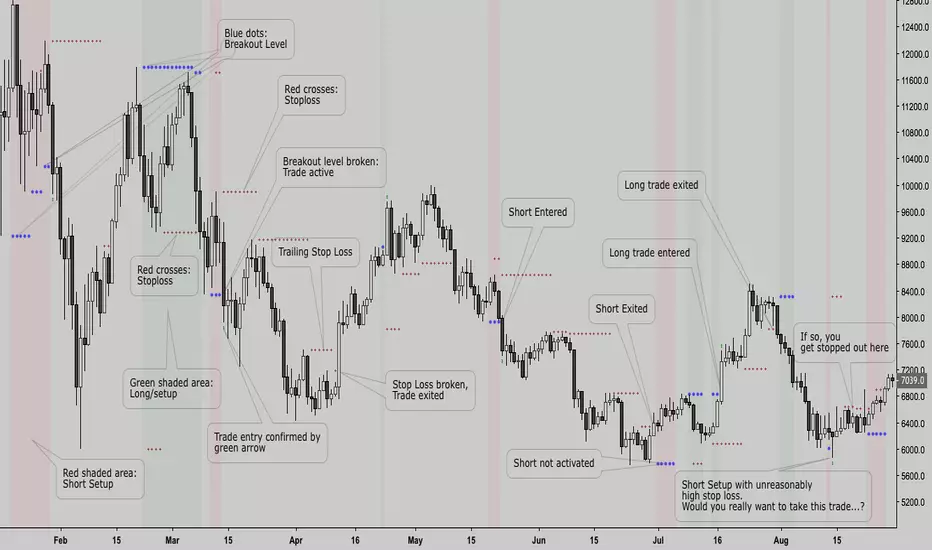
The shaded areas on the chart indicate that a trade setup has been detected by the algorithm: Green for bullish setups, red for bearish setups. The blue dots are the breakout level, if the price breaks this level the trade is entered. (as you can see on the chart, they can sometimes move towards the price!) Red crosses are plotted as your trailing stop loss, if price breaks the stop loss the trade is closed.
Zentrading Trend FollowerOur Trend following indicator is designed to get you in every trend safely, but perhaps most importantly, keeps you out of bad trades.
It performs well on all assets as it captures trending moves.
It does not only provide you with buy or sell signals you have to react on quickly, rather, it shows you when a trade setup is active. In this way you can anticipate the break of the breakout level to enter the trade. A trailing stop loss is used to exit.
It will work on all timeframes, but as lower timeframes add more noise to the market there will naturally be more losing trades than on higher timeframes. We recommend using it on anywhere from the weekly down to 1 or 2 HR -0.44% timeframes.
It is very simple to use:
The shaded areas on the chart indicate that a trade setup has been detected: Green for bullish setups, red for bearish setups.
The blue dots are plotted as the breakout level, if the price breaks this level the trade is entered. (as you can see on the chart, they can sometimes move towards the price!)
Red crosses are plotted as your trailing stop loss, if price breaks the stop loss the trade is closed.
This is a subscription indicator, please pm for information on how to access.
Happy trading!
Megalodon Pro+ Short Term IsolatorMEGALODON PRO+ Short Term Isolator
Megalodon Pro+ is designed for shorter term investors.
Megalodon Pro+ is really simple to use.
Megalodon Pro+ combines 16 different back-tested indicators , that each have more than 66% win rate.
Megalodon Pro+ lets you turn on or off any setups that have been used for a better analysis.
Megalodon Pro+ works with any kind of market state, and any kind of asset.
Megalodon Pro+ can be used to set alarms as soon as a candle closes with a green or red bar.
Megalodon Pro+ has more features than any other indicator in the market, these features can also be turned off in the settings:
Looks for 6 different shorter time frame setups automatically and prints them out.
Shows Mosasaur isolator and can also show Price, Volume and Momentum isolators.
Prints green or red bar s for shorter term signals .
--------------------------------------
MEGALODON PRO+ Short Term Isolator is designed for shorter term investors!
All you have to do is:
1- Apply it on any asset with 240 minutes and 60 minutes time frame and combine it with 1 Day MEGALODON PRO+ Long Term Isolator.
2- Look for green bar confirmation on all isolators.
3- Define your stop losses.
4- Define your target before you enter.
5-Repeat.
--------------------------------------
iPyra◬
Enlighten others

Megalodon Pro+ Long Term IsolatorMEGALODON PRO+ Long Term Isolator
Megalodon Pro+ is designed for longer term and shorter term investors.
Megalodon Pro+ is really simple to use.
Megalodon Pro+ combines 16 different back-tested indicators , that each have more than 66% win rate .
Megalodon Pro+ lets you turn on or off any setups that has been used for a better analysis.
Megalodon Pro+ works with any kind of market state, and any kind of asset.
Megalodon Pro+ can be used to set alarms as soon as a candle closes with a green or red bar.
Megalodon Pro+ has more features than any other indicator in the market, these features can also be turned off in the settings :
Looks for 12 different investing setups automatically and prints them out.
Shows 2 different viewing options: Setups View that shows how many bear or bull setups are currently formed, Isolator View that shows Megalodon Price,Volume and Momentum isolators.
Prints green or red bars for longer term signals.
--------------------------------------
MEGALODON PRO+ Long Term Isolator is designed for longer term and shorter term investors!
All you have to do is:
1- Apply it on any asset with 1Day time frame and combine it with 240minutes and 60 minutes Megalodon Pro+ Short Term Isolator.
2- Look for green bar confirmation on all isolators.
3- Define your stop losses.
4- Define your target before you enter.
5-Repeat
--------------------------------------
iPyra◬
Enlighten others

Megalodon ProMEGALODON PRO
Megalodon Pro is designed for longer term investors.
Megalodon Pro is really simple to use.
Megalodon Pro combines 16 different back-tested indicators , that each have more than 66% win rate .
Megalodon Pro works with any kind of market state, and any kind of asset.
Megalodon Pro can be used to set alarms as soon as a candle closes with a green or red arrow.
Megalodon Pro has more features than any other indicator in the market, these features can also be turned off in the settings :
Looks for 12 different investing setups automatically and prints them out.
Finds and prints longer term and shorter term Fibonacci Retracement levels.
Prints Long Fibonacci levels or Short Fibonacci levels.
Finds and prints a custom Fibonacci level that you might want.
Shows overlapping Fibonacci levels for longer term and shorter term.
Overlays Bollinger Bands.
--------------------------------------
Megalodon Pro is designed for longer term investors!
All you have to do is:
1- Apply it on any asset with 1Day time frame .
2- Look for green arrow close.
3- Define your stop loss if you prefer to have it.
4- Define your target before you enter.
5-Repeat
--------------------------------------
iPyra◬
Enlighten others

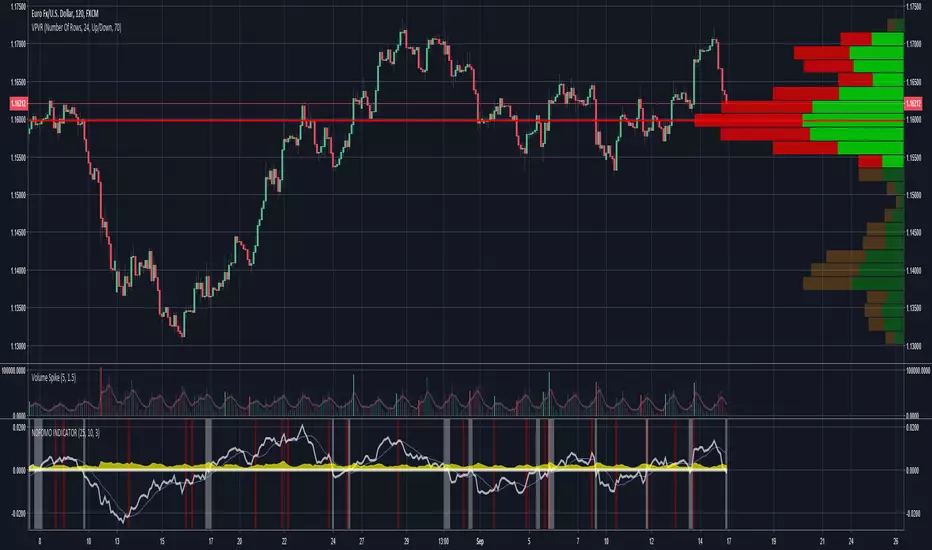
NOFOMO INDICATORNOFOMO Indicator
ABOUT:
This indicator can be used in conjunction with alerts to detect shifts in Momentum, which usually occur before volatility. ATR (Average True Range) is included as a measurement of volatility.
Momentum(White Line)
Zero Line(White Line)
Momentum SMA(Blue Line)
Average True Range(Yellow Area)
Momentum Crossover Momentum SMA(Red Highlight)
Momentum Cross Zero Line(White Highlight)
BASIC USE FOR TRADING:
Suggested Time-Frame: 30m, 1h, 2h, 4h
When Momentum crosses the “0” line this indicates a strong change in price action. You can observe price begin or continue to go UP after Momentum crosses the “0” line from the downside, moving upward. Likewise for downward movement as well. If you observe Momentum cross the “0” line from the upside moving downward, you will observe price begin or continue to move downward.
Prior to Momentum crossing the “0” line we can observe Momentum crossing over a light blue line, the SMA. Momentum crossing over the SMA indicates the initial change in price action and in some cases, can be used to verify or signal entry. One could theoretically use the Momentum/SMA cross as an alert, the Momentum crossing the “0” line as entry. One could also theoretically use a volume spike as an alert and the Momentum/SMA cross for entry. The point is that this indicators can be used in confluence with other indicators, and it can be used in various ways.
The most effective way to use either of the crosses (MOM/SMA or MOM/0 line) is to verify them against analyzing volume. Lets say you are using the MOM/SMA cross as an alert, and the momentum crossing “0” line as your entry signal. Once alerted, you will observe that Momentum has crossed the SMA and is heading toward the “0” line. Studying the price action and the volume bars, you can determine if the current price action has enough “fuel” to push momentum through the “0” line and begin its new trend.
The easiest way to analyze the volume for validity is to look for ascending volume bars that “grow” in proportion to price. For example a long candle stick should be associated with a tall volume bar, and a small candle stick should be associated with a short volume bar. This is not always the case though and further studies in to volume price analysis will be required on your end if you wish to use this indicator effectively with volume.
Authors: Sheldon#7775 & Walshdil#8568 (Discord)
BB Squeeze Momentum Indicator [PPS]Buy when the oscillator is lime color and the background is green.

QTi65 FORMULAFind low risk entry points with this momentum Indicator formula.
Swing Trading using momentum and breakout idea.

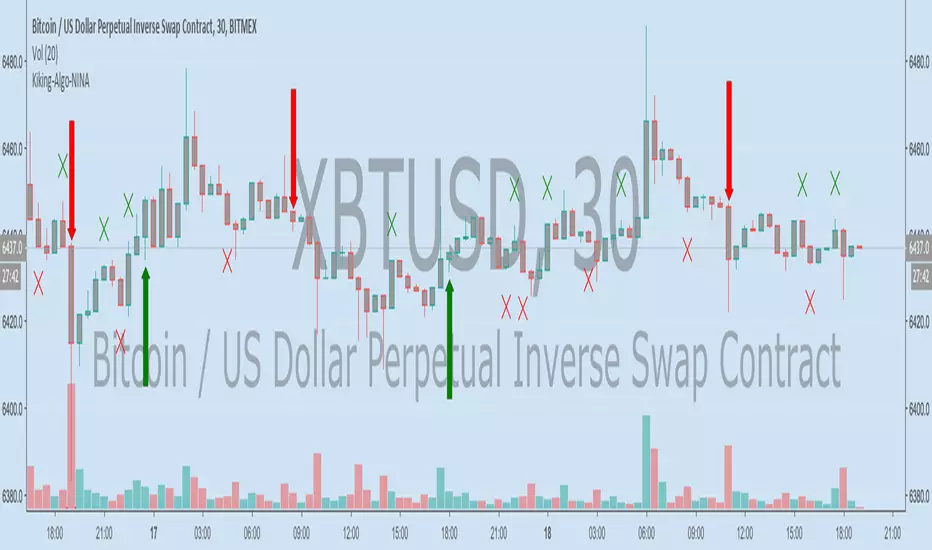
NINAHello Fellow Traders !
KikingAlgo has produced an amazing indicator which is now fully operational and ready for trading.
This indicator is called NINA and is based on Volume, Volatility, Momentum and Price to create spectacular signals based on the current market conditions.
The Indicator can operate on any market, any pair in any timeframe.
Feel free to PM me for details.
Regards
KikingAlgo